English

• 1. The Architecture of the Index
BIEL = BIEL-G × 0.80 + BIEL-F × 0.20
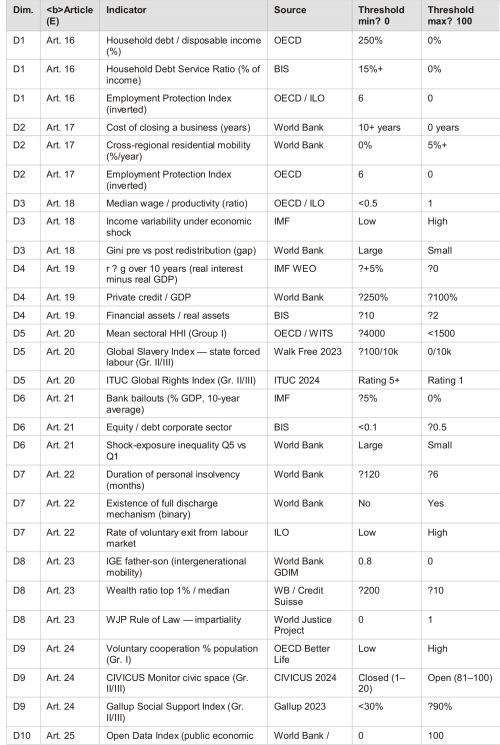
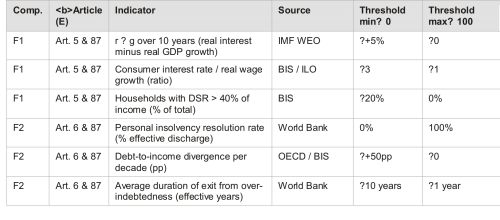
BIEL-G (the General Index) comprises 10 dimensions with equal weights (10% each), derived directly from the 10 criteria of architectural admissibility set out in Title III of the Constitution (E) (Articles 16-25). BIEL-F (the Financial Subindex) is a separate component with two equal sub-components: F1 (interest as a mechanism of structural constraint) and F2 (debt with structural impossibility of repayment). The 80/20 weighting reflects the paradigmatic status of interest in the Constitution - not an equal weight with the other dimensions, but neither a marginal one.
• 2. The Ten BIEL-G Dimensions and Their Indicators
Each dimension = 10% of BIEL-G. The score = arithmetic mean of three indicators normalised on the 0-100 scale. val_min → 0 points; val_max → 100 points. Linearly interpolated.
• 3. The Financial Subindex (BIEL-F)
BIEL-F = (F1 + F2) / 2
BIEL-F is separated from BIEL-G because the Constitution (E) treats interest as the paradigmatic example of structural constraint, not as a dimension equal to the others. A system may perform well on all ten dimensions and yet produce severe structural constraint through its financial architecture.
• 4. Dual D5/D9 Methodology for Non-OECD Countries
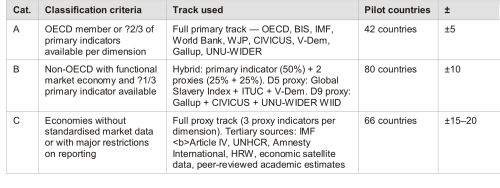
D5 (Absence of Predation) and D9 (Social Cohesion) have, in their primary formulation, indicators with coverage limited to the OECD countries. The solution adopted is a dual methodology with an A/B/C classification of each country.
• 5. The Calculation Protocol
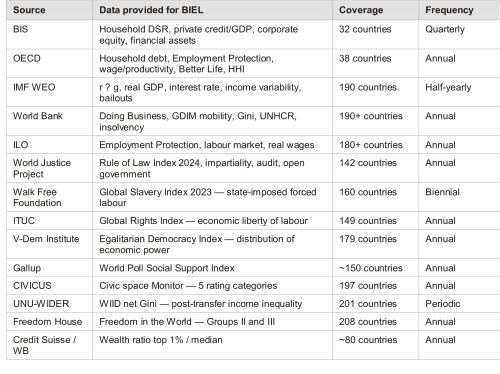
Step 1. Collection of raw data from the public databases. Frequency: annual. Reference horizon: 5-year average to reduce cyclical volatility.
Step 2. Normalisation of each indicator on the 0-100 scale. The thresholds val_min and val_max are fixed (not min/max from the sample) to ensure scale stability over time.
Step 3. Score per dimension D1-D10 = arithmetic mean of the three component indicators.
Step 4. BIEL-G = (D1 + D2 + D3 + D4 + D5 + D6 + D7 + D8 + D9 + D10) / 10.
Step 5. F1 = mean of the three F1 indicators; F2 = mean of the three F2 indicators; BIEL-F = (F1 + F2) / 2.
Step 6. Final BIEL = BIEL-G × 0.80 + BIEL-F × 0.20.
Step 7. Publication of the disaggregated scores (per dimension and subindex) alongside the aggregate score, indicating the A/B/C category and the stated uncertainty interval.
• 6. Frequency of Updating and Revision
BIEL is calculated and published annually in BURSA Newspaper. The normalisation thresholds are revised every five years on the basis of accumulated data. The A/B/C classification of countries is revised every five years, or whenever a country acquires or loses the data coverage required for the higher category.
• 7. Stated Methodological Limitations
Effective versus formal liberty. Some indicators capture the legal framework, not the real effect. The methodology gives priority to outcome indicators over de jure indicators, but this substitution is not entirely possible with the current data.
Endogeneity of thresholds. The normalisation thresholds are semi-empirical, based on the economic literature and the existing empirical consensus. They will be revised periodically.
Aggregation by arithmetic mean. This permits the compensation of scores - a high score on D8 may mask a low score on D1. Publication of the disaggregated profile is mandatory for correct use.
Uncertainty of Group III. The scores of Group III countries have an uncertainty of ±15-20 points. Direct comparisons with Groups I and II must be treated with caution.
• 8. Data Sources
Reproduction of the BIEL scores is permitted with citation of the source: Florian Goldstein (MAKE), BURSA Index of Effective Liberty (BIEL), BURSA Newspaper, 2026 Edition. Scores modified from the basic methodology may not use the designation BIEL.
© 2026 BURSA Newspaper. All rights reserved.
EDITURA BURSA

























 Euro
Euro Dolar SUA
 Franc elveţian
 Liră sterlină
 Gram de aur